Debug Tests
Some tests fail even when your website works as intended. This guide describes tools and strategies that you can use to fix failing TestCafe tests.
Table of contents
- Common reasons for test failure
- Debug mode
- Visual Selector debugger
- Quarantine mode
- Node.js debugger
- Adjust timeouts
- Adjust test speed
- Take screenshots on test failure
- Skip JavaScript errors
Common reasons for test failure
Most tests fail for one of the following reasons:
If you don’t understand what causes a test to fail, try one of the following strategies:
- Enter debug mode and inspect the page.
- Take screenshots and videos of the test to capture the moment of failure.
- Decrease test execution speed to pinpoint the cause of failure.
If a test yields inconclusive results, determine the reason for its irregular behavior. If you can’t resolve the issue, quarantine the test to rule out false negatives.
Element Selector issues
Actions and assertions use Element Selector queries to interact with the DOM. Imprecise and poorly written Element Selector queries may cause actions and assertions to fail or yield unexpected results.
- Make sure that your Selectors adhere to the recommended guidelines.
- Use the Visual Selector debugger to troubleshoot Element Selector queries.
- If your Selector query is correct, but TestCafe cannot find the page element in time, adjust the Element Selector timeout.
- If an assertion fails before your application updates page content, adjust the Assertion timeout.
See also: My tests fail because TestCafe cannot locate a page element. Why does this happen?
Network issues
TestCafe tests fail when the browser fails to load a web page.
- If your server is slow to respond, increase the Page request timeout or the AJAX request timeout.
- Enable the Retry Test Pages option to retry unsuccessful page requests.
- If TestCafe routes your request through a low bandwidth proxy, turn the proxy off, or bypass the proxy when you access a particular resource.
- TestCafe uses two network ports in the [0 - 65535] range to automate browsers. TestCafe cannot run if your firewall blocks network activity on these ports.
Browser issues
TestCafe tests fail when browsers disconnect or malfunction.
- If you run multiple browsers concurrently, you may exhaust your system resources. Poor browser performance can negatively impact test performance. Decrease the concurrency factor or run your browsers in headless mode.
- TestCafe fails when a browser does not initialize within the browser initialization timeout. Increase the timeout to account for slow browser performance.
- TestCafe may experience performance issues if you minimize the browser window, or run the test in a background tab. The operating system detects that the browser runs in the background, and does not allocate the necessary amount of system resources to the test run.
- TestCafe automatically restarts browsers that appear unresponsive. If TestCafe restarts your browser by mistake, enable development mode to prevent this behavior.
Application errors
- If your application yields a JavaScript error, TestCafe fails the test. If you cannot fix the JavaScript error in question, enable the skipJsErrors option to let tests proceed.
- If your application is slow to load, adjust the page request timeout.
Debug mode

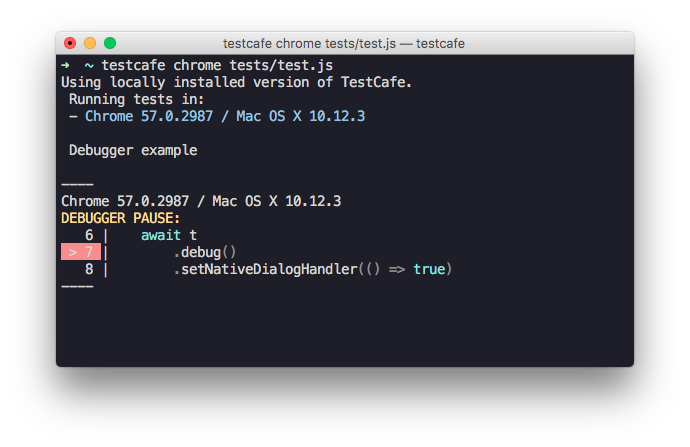
If you launch TestCafe in debug mode, TestCafe pauses the test before the first action. You can then advance the test step by step, inspect the page, and use the Visual Selector debugger.
TestCafe displays information about breakpoints in the test log:
Enable the debugMode setting to enter debug mode:
- Command Line Interface
testcafe chrome test.js --debug-mode - Configuration File
{ "debugMode": true } - TestCafe Test Runner API
await runner.run({ debugMode: true});
To enter debug mode on test failure, enable the debugOnFail option:
- Command Line Interface
testcafe chrome tests/sample-fixture.js --debug-on-fail - Configuration File
{ "debugOnFail": true } - TestCafe Test Runner API
await runner.run({ debugOnFail: true});
Use the t.debug action to manually add a breakpoint. If you include a Selector query as the argument, TestCafe automatically passes the query to the Visual Selector Debugger.
fixture `Debugger example`
    .page `http://devexpress.github.io/testcafe/example/`;

test('Debugger', async t => {
    await t
        .debug()
        .setNativeDialogHandler(() => true)
        .click('#populate')
        .click('#submit-button');
});
Important
When you enter debug mode with native automation enabled, the web page does not freeze. The application reacts to clicks, hovers, and other interactions.
Visual Selector debugger
Use the Visual Selector debugger to interactively debug and generate Selector queries.
- Enter a Selector query to see page elements that match it.
- Click a page element to generate a Selector query.
- Click the “Hide Picker” button to disable the debugger and hide the Selector input field.
If you pass a Selector query to the t.debug() method, TestCafe automatically inserts the query into the input field of the Visual Selector Debugger, and highlights page elements that match the query.
Quarantine mode
Enable quarantine mode to eliminate false negatives and detect unstable tests. When a test fails, TestCafe quarantines it, and repeats it until the test yields conclusive results.
Enable quarantine mode with the -q (--quarantine-mode) command line flag, the quarantineMode configuration file setting, or the quarantineMode Test Runner option:
- Command Line Interface
testcafe chrome ./tests/ -q - Configuration File
{ "quarantineMode": true } - TestCafe Test Runner API
await runner.run({ quarantineMode: true });
Node.js debugger
You can debug server-side code in Chrome Developer Tools and popular IDEs.
Important
Use the Visual Selector debugger to debug Element Selector queries.
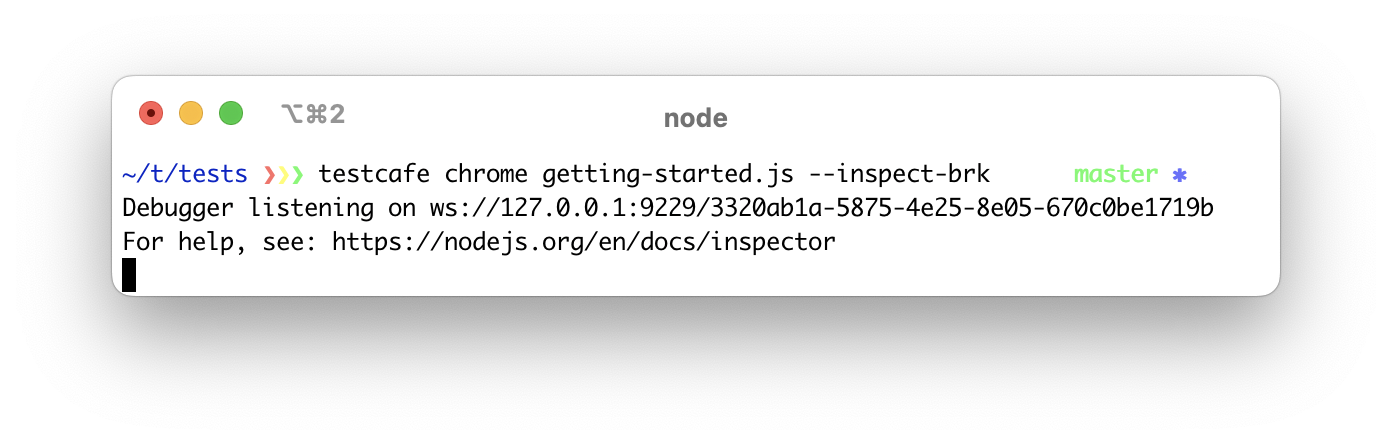
Specify the --inspect-brk CLI flag to launch a Node.js debugger and use the Google Chrome Developer Tools panel:
testcafe --inspect-brk chrome ./tests
For more information on debugging Node.js code in your text editor, read the following tutorials:
Adjust timeouts
Note
High timeout values may increase the total runtime of your test suite.
- Selector timeout
- Assertion timeout
- Page load timeout
- Page request timeout
- AJAX request timeout
- Browser initialization timeout
- Test execution timeout
- Run execution timeout
Selector timeout
If the action target is slow to appear, investigate the root cause of the issue. If you cannot improve the performance of your network or application, increase the Selector timeout.
If TestCafe fails to resolve an element selector query within the Selector timeout period, the test fails.
Default value: 10000 ms
Specify the timeout option to change the Selector timeout for an individual Selector query:
const footerSelector = Selector('#footer', { timeout: 20000 });
Use one of the following options to change the Selector timeout for the entire test run:
- Configuration File
{ "selectorTimeout": 3000 } - Command Line Interface
testcafe chrome my-tests --selector-timeout 500000 - TestCafe Test Runner API
await runner.run({ selectorTimeout: 50000 });
Assertion timeout
If an assertion fails because your application is slow to update its content, investigate the root cause of the issue. If you cannot improve the performance of your application, increase the Assertion timeout.
TestCafe executes compatible assertions multiple times within the Assertion timeout period, repeating measurements and calculations with each attempt. If an assertion does not succeed, the test fails.
Default value: 3000 ms
Specify the timeout option to change the timeout for an individual assertion:
await t.expect(Selector('h1').innerText).eql('Hello World!', { timeout: 20000 });
Use one of the following options to change the assertion timeout for the entire test run:
- Configuration File
{ "assertionTimeout": 1000 } - Command Line Interface
testcafe chrome my-tests --assertion-timeout 10000 - TestCafe Test Runner API
await runner.run({ assertionTimeout: 50000 });
Page Load timeout
The Page Load timeout defines the maximum amount of time between the DOMContentLoaded event and the window.load event. TestCafe applies the timeout when the user delays test execution until the window.loadEventRaised event.
Default value: 3000 ms
Use the test.timeouts method to change the page load timeout for an individual test:
test('My test', async () => {
    /* test code goes here */
}).timeouts({ pageLoadTimeout:    5000 });
Use one of the following options to change the page load timeout for the entire test run:
- Configuration File
{ "pageLoadTimeout": 5000 } - Command Line Interface
testcafe chrome my-tests --page-load-timeout 5000 - TestCafe Test Runner API
await runner.run({ assertionTimeout: 50000 });
AJAX request timeout
Note
Disable native automation to adjust the AJAX request timeout.
If your application is slow to respond to AJAX requests, investigate the root cause of the issue. If you cannot improve the performance of your application, increase the AJAX request timeout.
If TestCafe does not resolve an XHR/Fetch request within the AJAX request timeout period, the test fails.
Default value: 120000 ms
Use the test.timeouts method to change the AJAX request timeout for an individual test:
test('My test', async () => {
    /* test code goes here */
}).timeouts({ ajaxRequestTimeout:    5000 });
Use one of the following options to change the AJAX request timeout for the entire test run:
- Configuration File
{ "ajaxRequestTimeout": 40000 } - Command Line Interface
testcafe chrome my-tests --ajax-request-timeout 40000 - TestCafe Test Runner API
await runner.run({ ajaxRequestTimeout: 50000 });
Page request timeout
Note
Disable native automation to adjust the Page request timeout.
If your application is slow to respond to HTTP requests, investigate the root cause of the issue. If you cannot improve the performance of your application, increase the Page request timeout.
If the server does not fulfill a page request within the Page request timeout period, the test fails.
Default value: 25000 ms
Use the test.timeouts method to change the page request timeout for an individual test:
test('My test', async () => {
    /* test code goes here */
}).timeouts({ pageRequestTimeout:    5000 });
Use one of the following options to change the page request timeout for the entire test run:
- Configuration File
{ "pageRequestTimeout": 8000 } - Command Line Interface
testcafe chrome my-tests --page-request-timeout 8000 - TestCafe Test Runner API
await runner.run({ pageRequestTimeout: 8000 });
Browser initialization timeout
If your browser is slow to launch, investigate the root cause of the issue. If you cannot improve the performance of your testing environment, increase the Browser initialization timeout.
If one or more browsers fail to connect to TestCafe within the Browser initialization timeout period, the test run fails.

Default value: 120000 for local browsers, 360000 for remote browsers.
- Configuration File
{ "browserInitTimeout": 180000 } - Command Line Interface
testcafe chrome my-tests --browser-init-timeout 180000 - TestCafe Test Runner API
await runner.run({ browserInitTimeout: 8000 });
Test Execution timeout
When the total execution time of a test exceeds the Test Execution timeout, TestCafe terminates the test, even if the browser is responsive.
Default value: none (timeout disabled)
Note
Continuous Integration systems offer built-in task runtime management capabilities. Use the Test Execution timeout when other options are not available.
- Configuration File
{ "testExecutionTimeout": 180000 } - Command Line Interface
testcafe chrome my-tests --test-execution-timeout 180000 - TestCafe Test Runner API
await runner.run({ testExecutionTimeout: 8000 });
Run Execution timeout
When the total execution time of a run exceeds the Run Execution timeout, TestCafe terminates the test run, even if the browsers are responsive.
Default value: none (timeout disabled)
Note
Continuous Integration systems offer built-in task runtime management capabilities. Use the Run Execution timeout when other options are not available.
- Configuration File
{ "runExecutionTimeout": 180000 } - Command Line Interface
testcafe chrome my-tests --run-execution-timeout 180000 - TestCafe Test Runner API
await runner.run({ runExecutionTimeout: 8000 });
Adjust test speed
Use the speed parameter to limit test execution speed. The parameter accepts values between 1 (the fastest speed, default value) and 0.01 (the slowest speed).
If you limit test execution speed, it is easier to notice differences in test behavior.
- Command Line Interface
testcafe chrome ./my-tests --speed 0.1 - Configuration file
{ "speed": 0.1 } - TestCafe Test Runner API
await runner.run({ speed: 0.1 });
Take screenshots on test failure
Enable the takeOnFails option to take screenshots on test failure. Use the screenshots to determine the cause of the failure.
Additionally, you can record test videos to review video footage of your tests.
Important
Video recording incurs a heavy system resource overhead. If you record too many videos simultaneously, test performance may suffer.
- Configuration File
{ "screenshots": { "takeOnFails": true } } - Command Line Interface
testcafe all tests/sample-fixture.js -s takeOnFails=true - TestCafe Test Runner API
runner.screenshots({
    takeOnFails: true
});
Skip JavaScript errors
Main article: Skip JavaScript Errors
TestCafe tests fail when a page yields a JavaScript error. Usually, errors are signs of malfunction that warrant action. However, in some cases third-party modules yield errors that the user cannot fix.
If you enable the skipJsErrors option, TestCafe deliberately ignores JavaScript errors and lets tests proceed.
- Use the CLI flag, the configuration file property, or the Test Runner API to ignore JavaScript errors throughout your entire test suite.
- Use the fixture.skipJsErrors method to ignore JavaScript errors for individual fixtures.
- Use the test.skipJsErrors method to ignore JavaScript errors in individual tests.
- Use the t.skipJsErrors action to ignore JavaScript errors at specific points in the test.
For each of the methods above, you can define the following options:
- The
pageUrloption filters errors by page URL. - The
messageoption filters errors by message. - The
stackoption filters errors by call stack.