Visual Selector Debugger
Article Summary
TestCafe v2.4.0 and up displays an interactive Selector Debugger panel when you activate Debug mode.

- Enter a Selector query to see page elements that match it.
- Click a page element to generate a Selector query.
Video demonstration
Debug a Selector query

If an incorrect Selector query causes one of your actions to fail, add the t.debug() command right before the failing action.
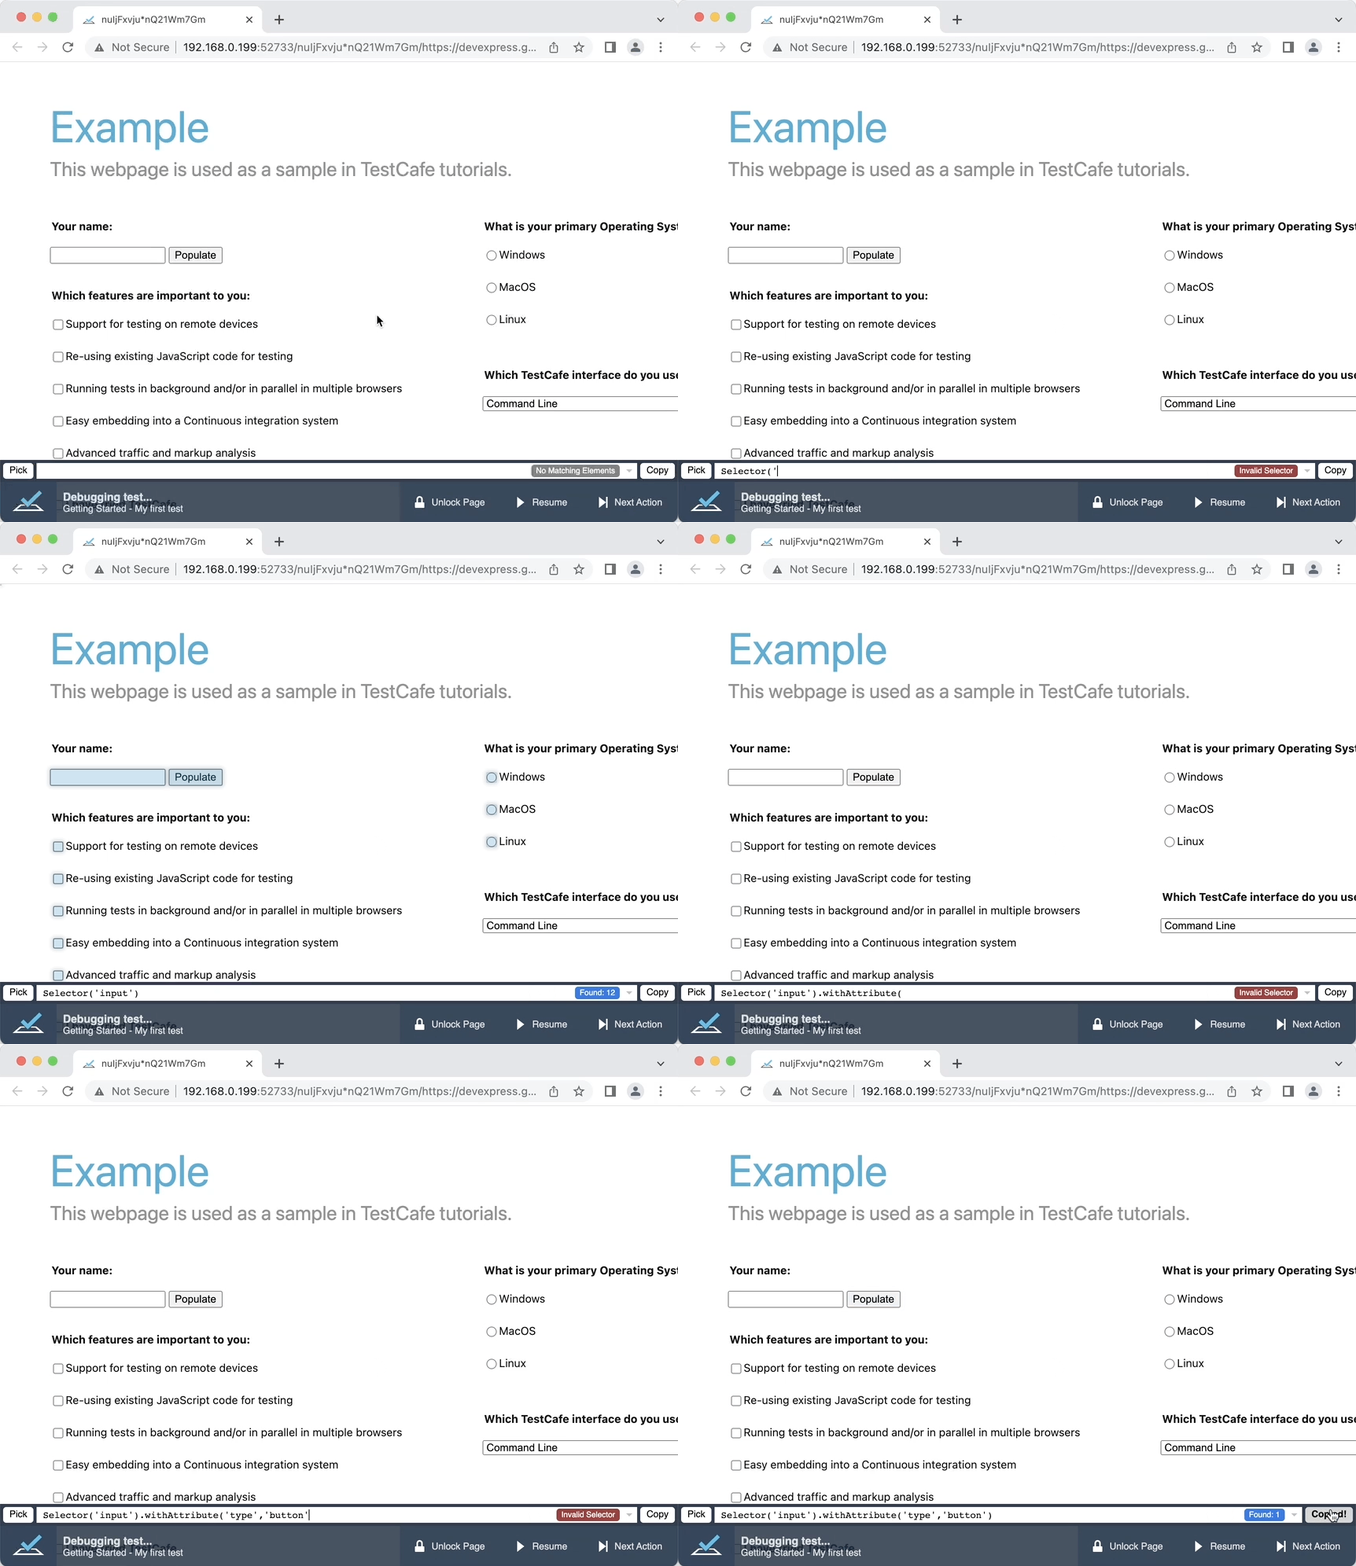
Launch the test. When the test reaches the breakpoint, the window that runs the test displays the Selector Debugger panel.
Copy the failing Selector query from test code to the Selector Debugger input field.
- TestCafe highlights page elements that match the Selector query. Note: TestCafe does not scroll these page elements into view.
- If no elements match the Selector query, the panel displays the No Matching Elements warning.
- If your Selector query contians a syntax error, the panel displays the Invalid Selector warning.
Modify your Selector query until TestCafe highlghts the correct page element. Or use the Pick button to generate the Selector query.
Important
The Visual Selector Debugger can only debug keyword-based Selector queries. Examples:
div > div inputp:nth-child(2)span[custom-attribute="value"].classNameSelector('.my-class')Selector('div').withText('Hello World!')
Debug a Selector query on launch
If you want to populate the input field of the Visual Selector Debugger when you debug your test, pass a Selector query to the t.debug method. TestCafe automatically highlights page elements that match the query.
Generate a Selector query

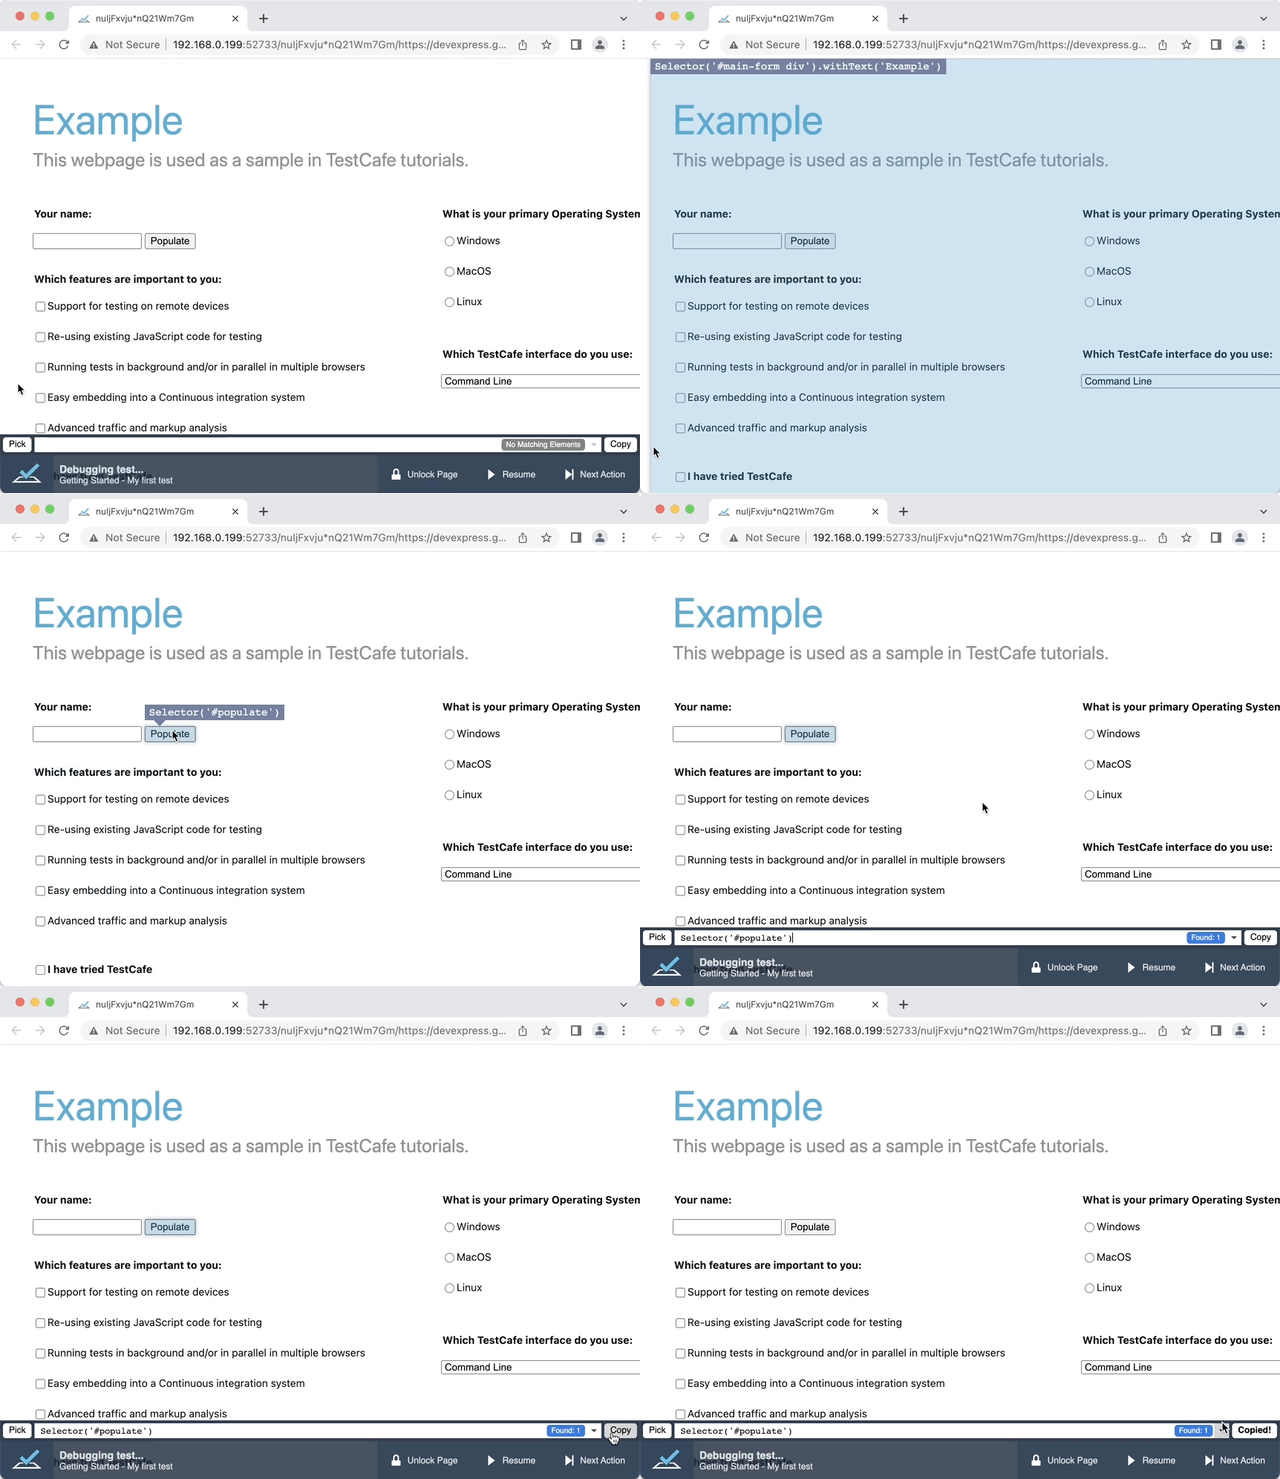
If you want to generate a Selector query, add the t.debug() command to your test. Make sure that you can access the target page element for your query when the breakpoint is active.
Launch the test. When the test reaches the breakpoint, the window that runs the test displays the Selector Debugger panel.
- Click the Pick button.
- Click the target element.
- TestCafe generates a matching Selector query and displays it in the text field. Click the Copy button to save it to the clipboard.
Enable and disable the Selector debugger
Click the “Hide Picker” button to disable the Selector debugger and hide the Selector input field.

Limitations
- The Selector Picker cannot interact with
iframecontents. - The Selector Picker cannot interact with the Shadow DOM.
- You cannot adjust the Selector generation algorithm.