Debug Tests in WebStorm
This topic describes how to debug TestCafe tests in WebStorm with a Node.js debugger.
Step 1 - Install TestCafe
Execute the following command to install TestCafe locally and add it to the devDependencies section in package.json:
npm install --save-dev testcafe
{
    "devDependencies": {
        "testcafe": "*"
    }
}
Step 2 - Add a Command To Debug TestCafe
Add a debug script to the scripts section in package.json. This script contains a command that runs TestCafe and specifies the target browser.
{
    "scripts": {
        "debug": "testcafe $NODE_DEBUG_OPTION chrome"
    },

    "devDependencies": {
        "testcafe": "*"
    }
}
The $NODE_DEBUG_OPTION placeholder marks a place where Node.js debugger options are inserted before execution.
The path to test files is specified in the debug configuration (step 4).
Step 3 - Create a Debug Configuration
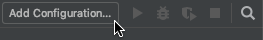
Open WebStorm. If no build or run configuration is set up, click Add Configuration in the top-right corner to invoke the Run/Debug Configurations dialog.
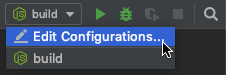
Otherwise, open the configuration drop-down menu and select Edit Configurations….
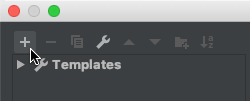
In the Run/Debug Configurations dialog, click the + button to create a new configuration from a template.
In the list of templates, select npm.
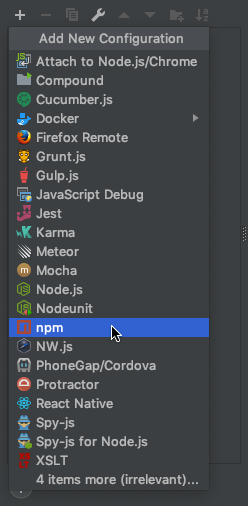
This creates a default npm configuration.
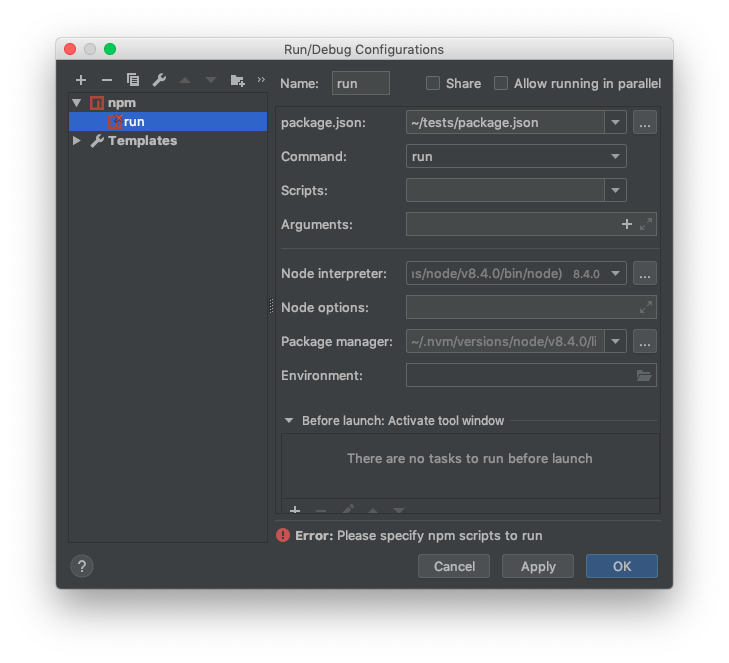
Step 4 - Specify Configuration Options
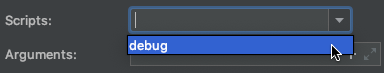
Select the npm script (debug) in the Scripts field.
WebStorm version prior to 2018.3
Specify the path to the test file you wish to debug in the Arguments field.
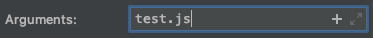
Change this setting later to debug a different file.
WebStorm version 2018.3 and newer
Click the + button in the Arguments field to insert a macro.
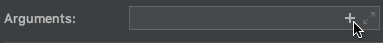
This invokes the Macros dialog.
Select
FilePathto insert the path to the current file.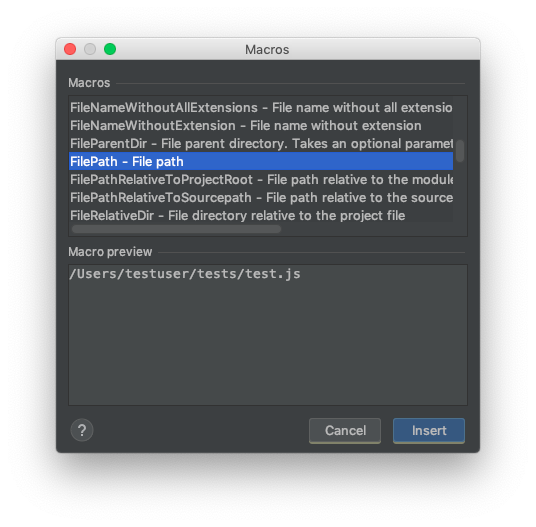
Click Insert. A macro
$FilePath$is inserted to the Arguments field.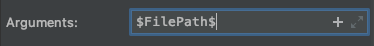
This allows WebStorm to debug the currently opened test file.
Click OK to save changes.
Step 5 - Debug Tests
Open the file you wish to debug and put a breakpoint into it.
Select the debug configuration you have created and click Debug.
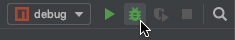
TestCafe runs the test and stops at the breakpoint.

Now you can use WebStorm debugging tools to inspect the code, step over to the next command, etc.
Note
The debugger may consider a TestCafe action chain as a single command and therefore fail to correctly step between these actions. In this instance, put a breakpoint at each chained action.