Debug Tests in Chrome Developer Tools
Specify the --inspect-brk CLI flag to launch a Node.js debugger.
testcafe --inspect-brk chrome ./tests
Use the debugger keyword to set a breakpoint.
fixture `My fixture`
    .page `https://devexpress.github.io/testcafe/example`;

test('My test', async t => {
    debugger;
    await t
        .setNativeDialogHandler(() => true);
        .click('#populate')
        .click('#submit-button');
});
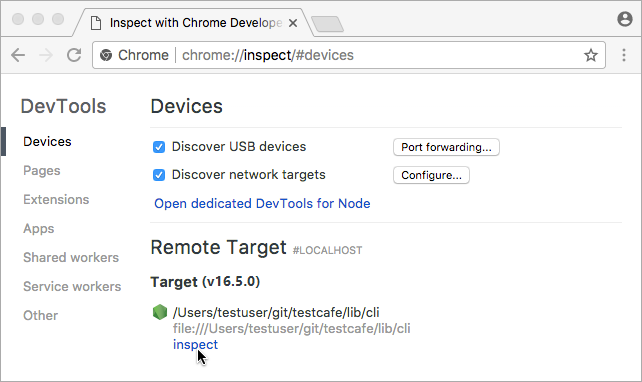
Open the Chrome inspector (chrome://inspect) and find the TestCafe Node.js debug process in the Remote Target. Click Inspect to invoke the debugger with your test code.
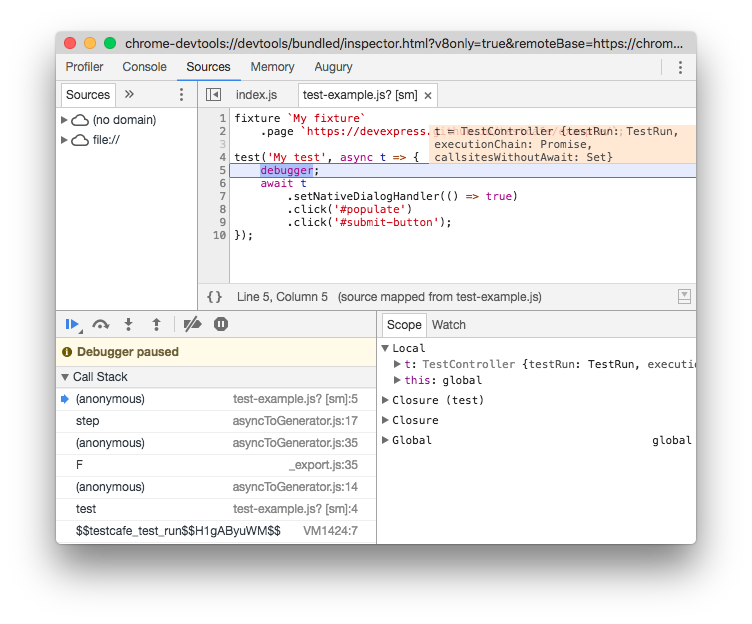
Chrome invokes its Developer Tools and the debugger stops test execution at the first line. Click the “Resume script execution” button or press F5 to continue. Test execution pauses at each breakpoint or debugger keyword in test code.