Selector Debugging
Important
TestCafe v2.4.0 introduced the Visual Selector Debugger — a new way to interactively generate and debug Selector queries.
Warning
This article describes an experimental capability. Feel free to try it out and share your feedback with the TestCafe team. Do not use experimental capabilities for business-critical tasks — you may encounter bugs and lack of stability.
If you launch TestCafe with the --experimental-debug flag, you can debug Selectors and Client Functions in the Watch panel of a Node.js debugger.
Quick Guide (VSCode)
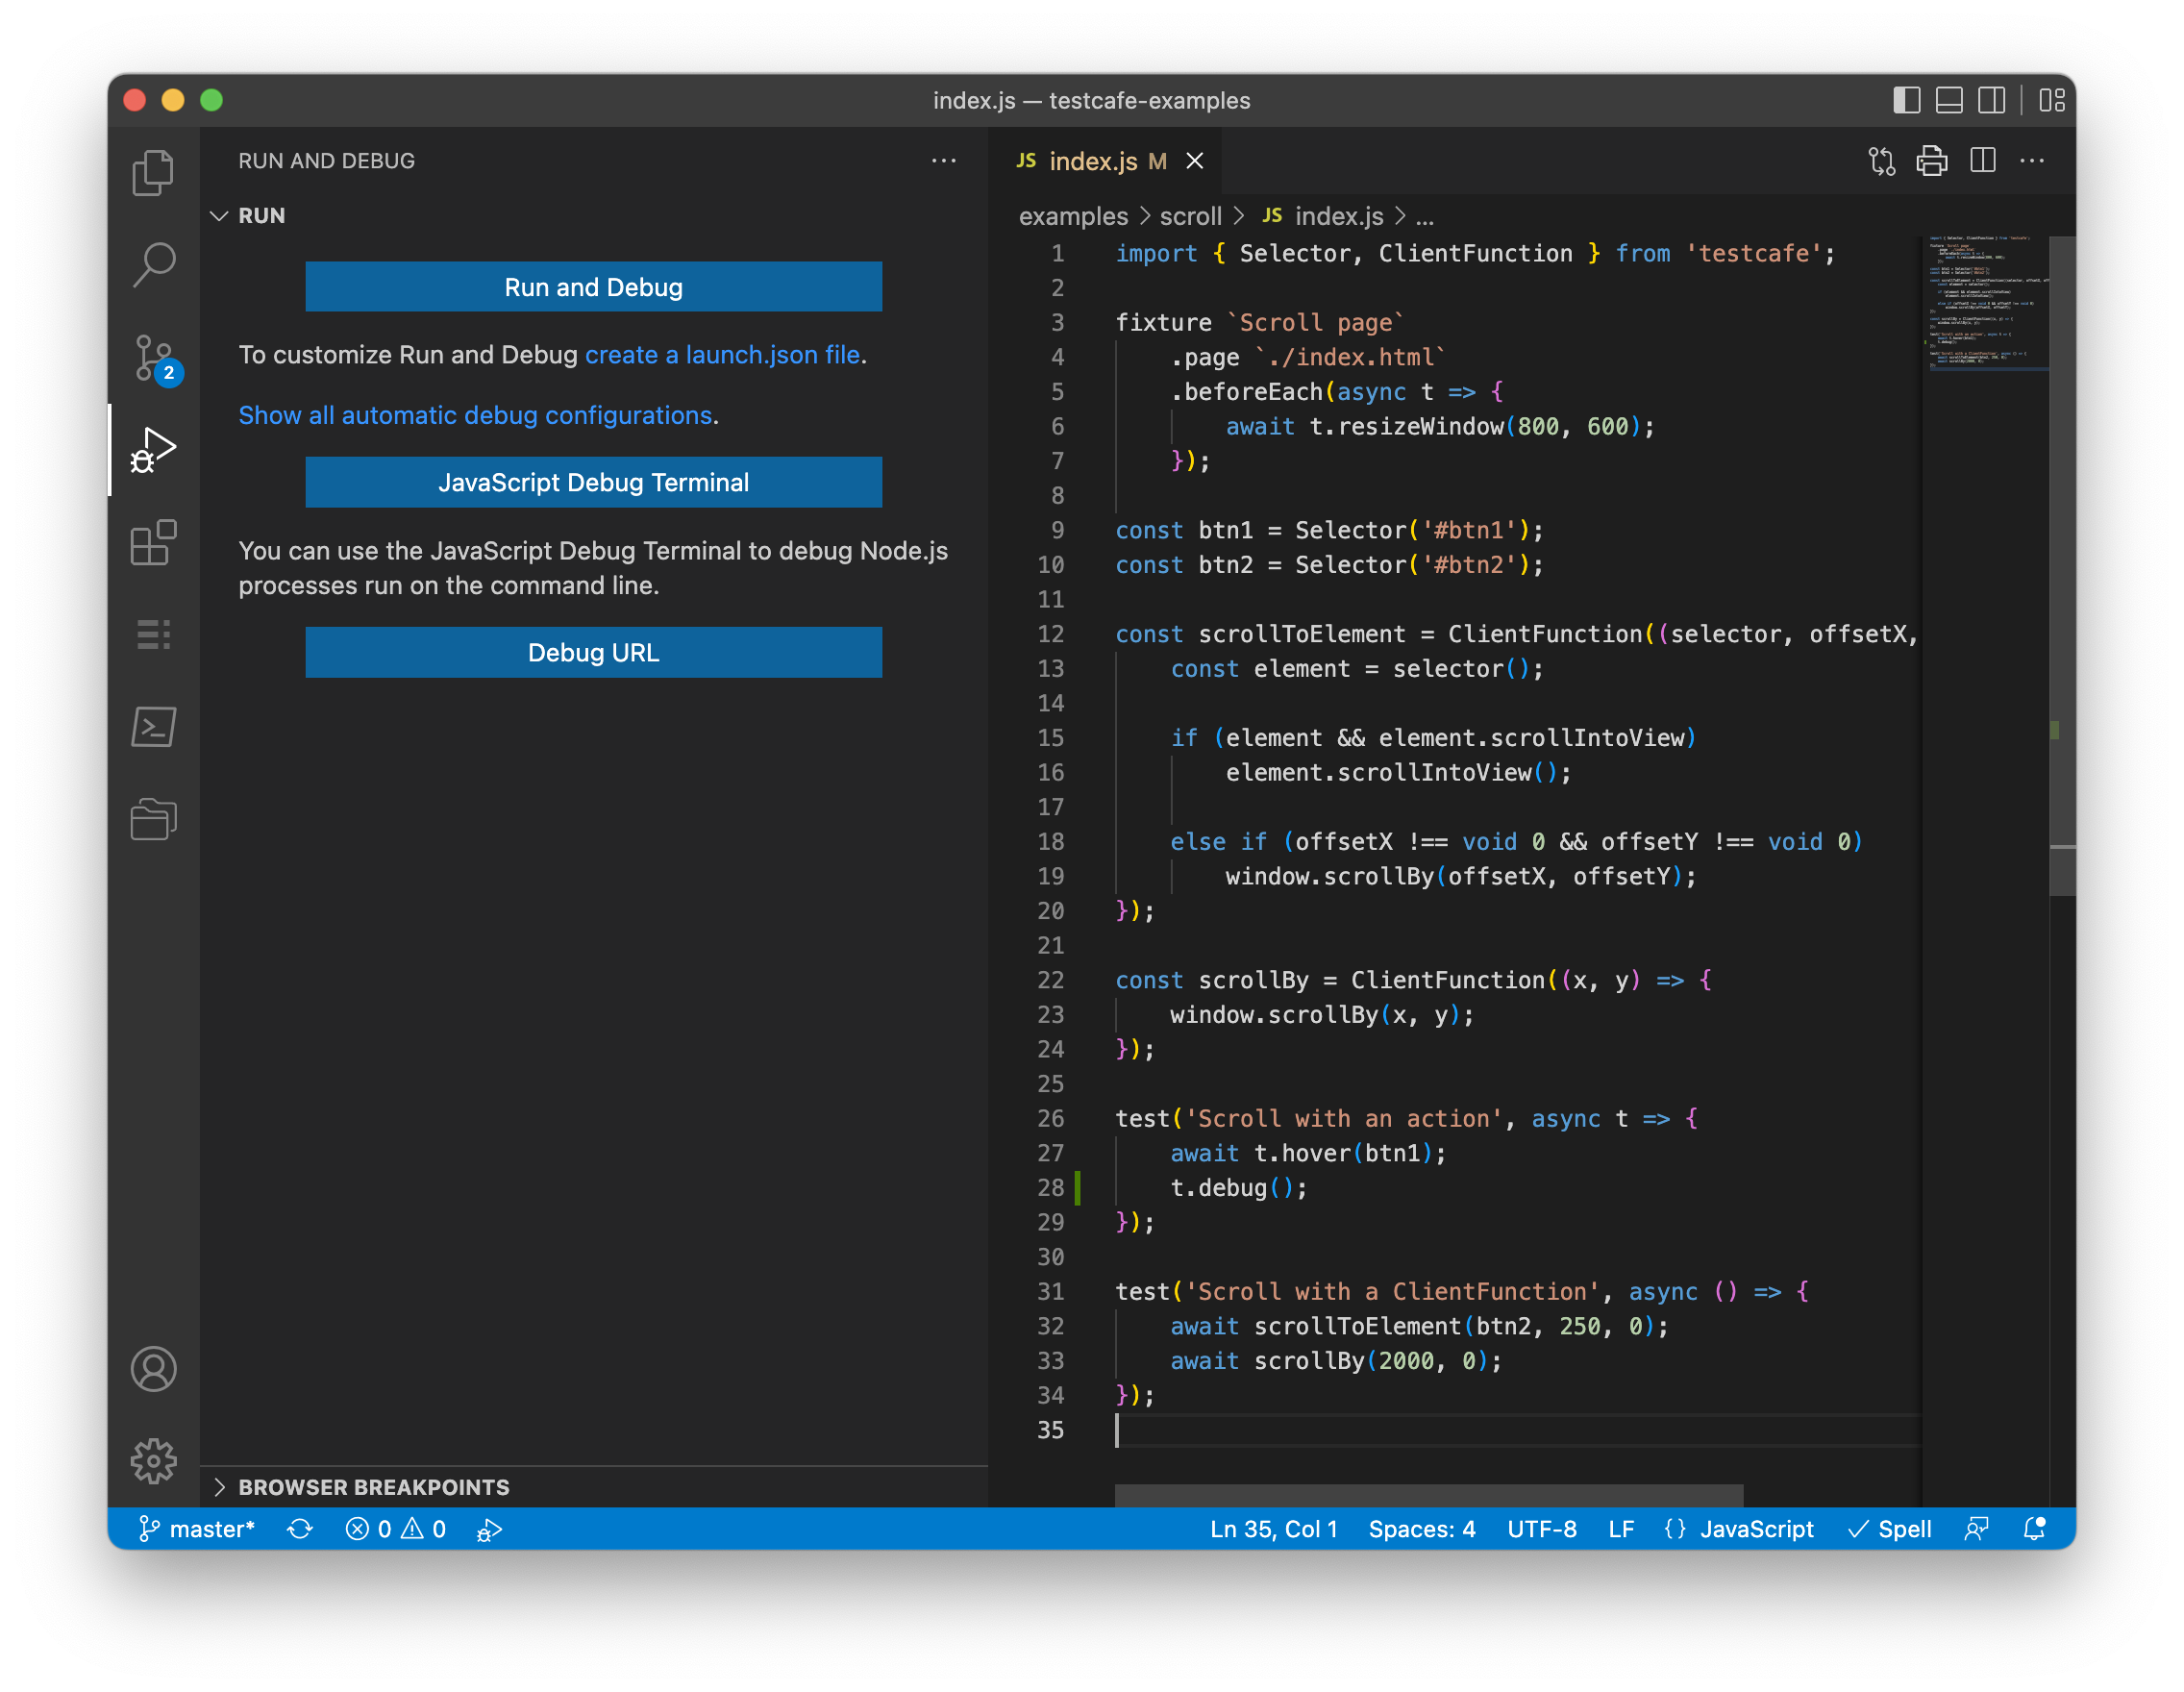
- Add a breakpoint to your test with the t.debug action.
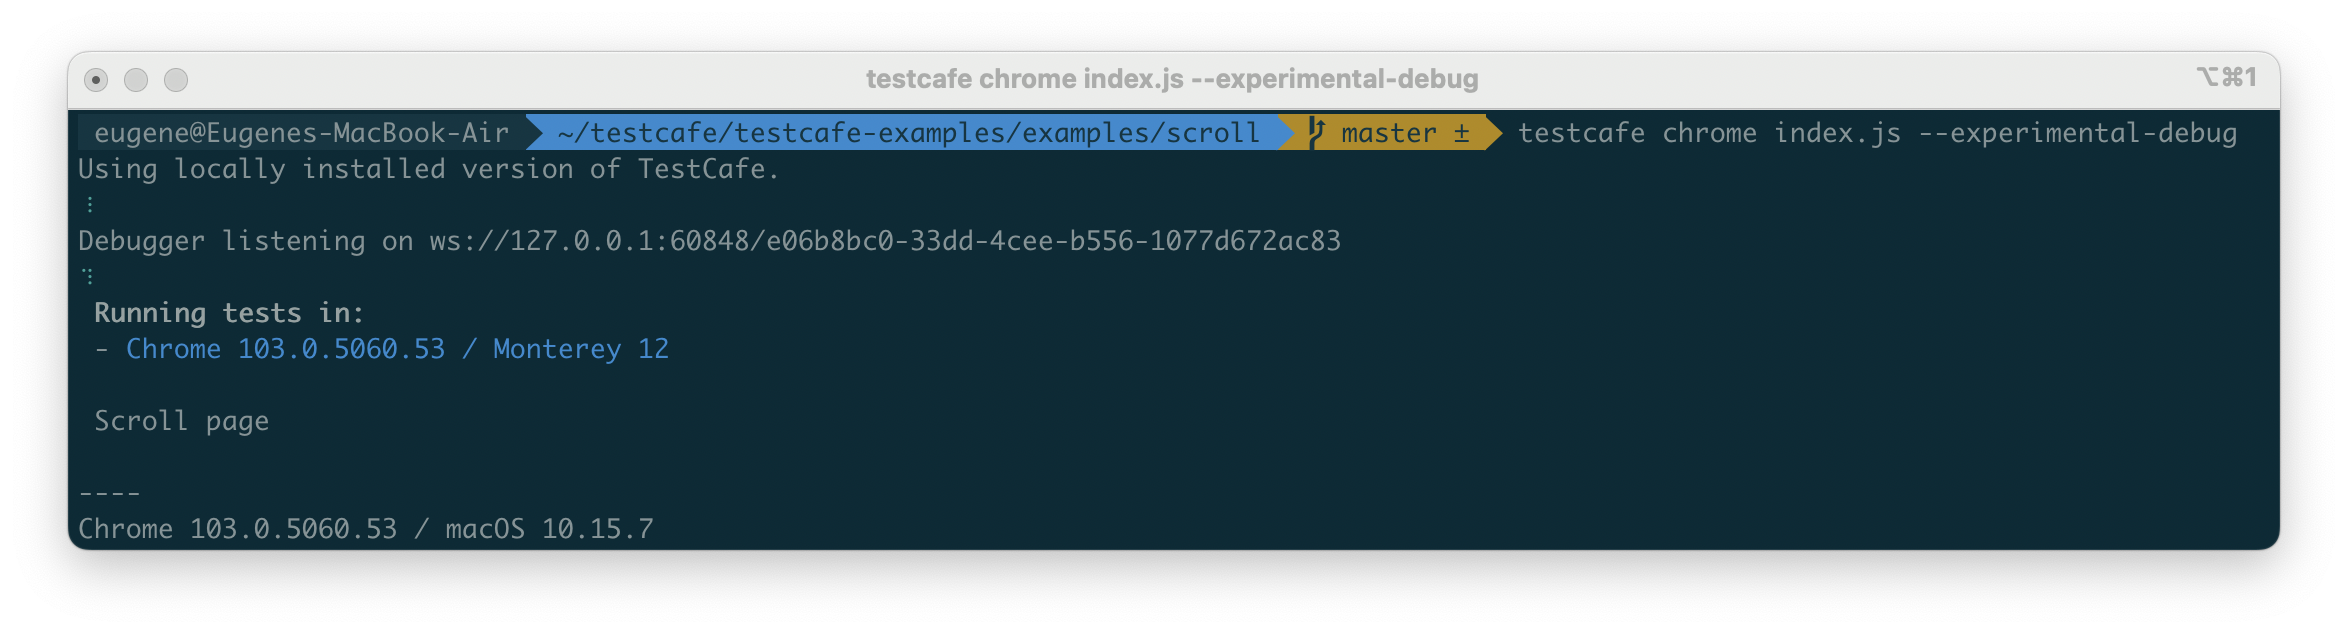
Run the test with the
--experimental-debugflag:testcafe chrome index.js --experimental-debugTestCafe outputs the Debugger URL to the Console when you launch the test.
In Visual Studio Code, open the “Run” menu and click “Start Debugging”.
Click the “Debug URL” button in the “Run and Debug” pane and input the URL from the command line.
Use the Watch panel of the Node.JS debugger to evaluate Selectors and Client functions.