Introducing the TestCafe Jenkins Plugin
TestCafe can capture videos and screenshots so you can debug your tests and examine page UI. You can record all tests or only those that failed, generate unique video files for each test or record all of them in one take, and single out specific interactions. (For a full list of available options, see the following help topic: Screenshots and Videos).
Many TestCafe users take advantage of Jenkins — a CI/CD solution — to automate their tests. Until recently, they had to manually match the screenshots and videos taken by TestCafe to the individual test reports. The newly implemented TestCafe Jenkins plugin simplifies this process. Links to screenshots and videos taken during the test now automatically appear on the Jenkins test results page. There is no need to keep the testing server running — all required files are stored inside the Jenkins build folder.
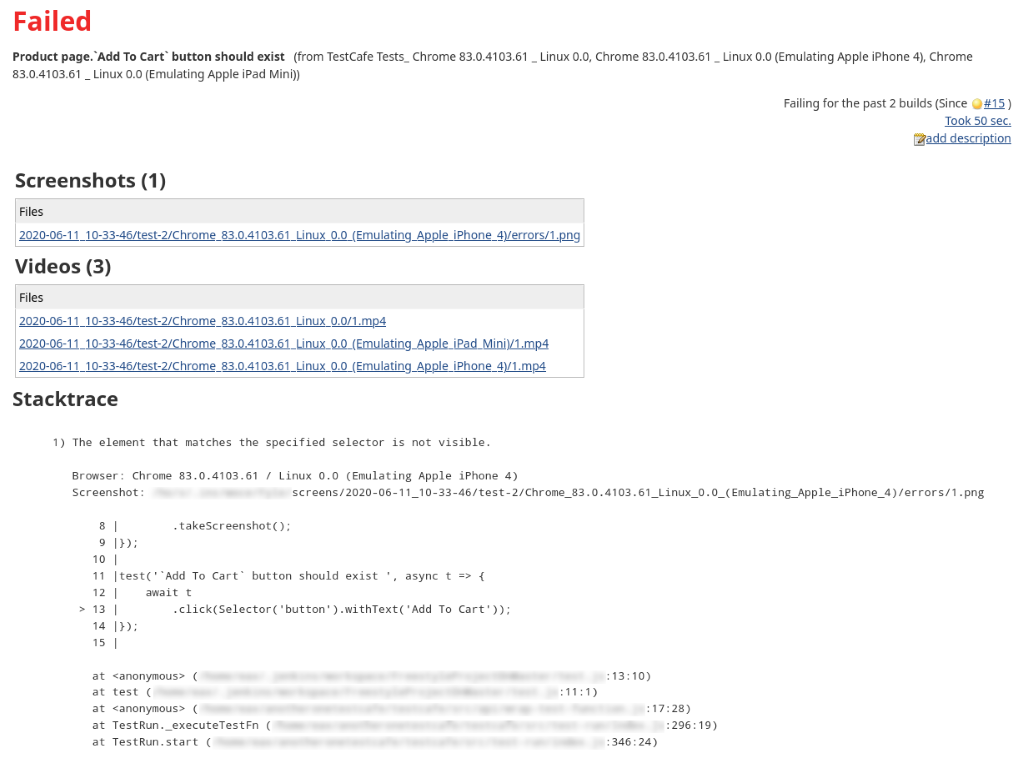
With our plugin enabled, the test results page should appear as follows:
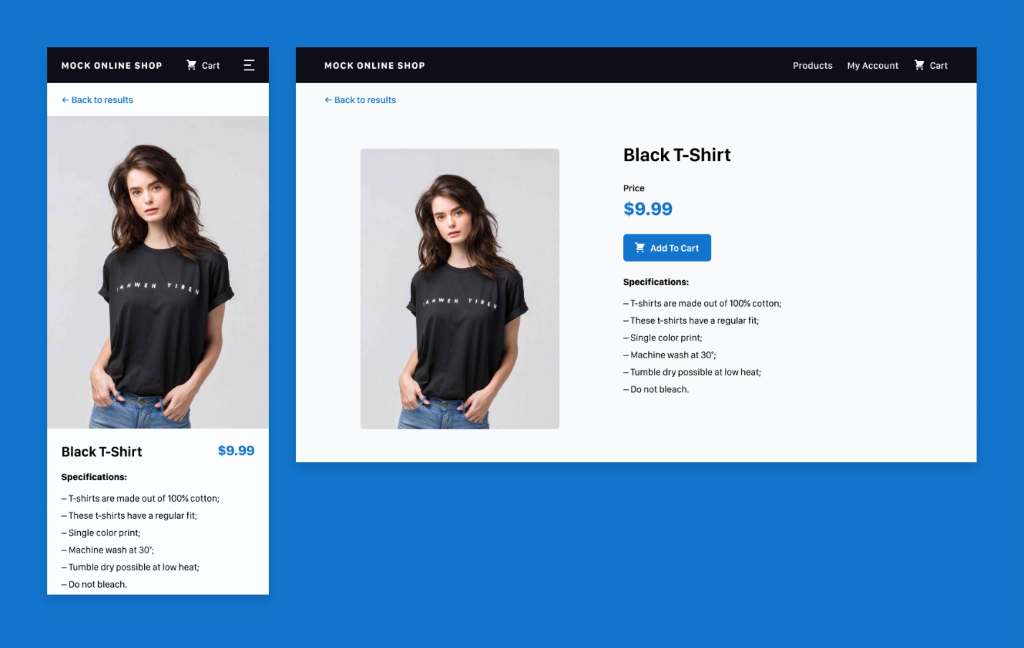
Test case: the disappearing button
Let’s assume that the ‘Add to Cart’ button disappears on the mobile version of your website.
TestCafe supports the following mobile device emulation methods:
- Resize the browser window during the test
- Run the test through a third-party cloud testing service
- Use Chromium’s built-in emulation mode
The third option offers greater speed and stability. We describe it going forward and recommend that you use it if possible.
First, let’s write a simple test that checks if the ‘Add to Cart’ button exists:
test('`Add To Cart` button should exist', async t => {
    await t
        .expect(Selector('button').withText('Add To Cart').visible).ok();
});
Now let’s configure Jenkins to launch this test every time we build our project.
Basic setup
Step 1. Install prerequisites
TestCafe requires a working Node.js installation to run. If your testing environment does not contain node.js, the Node.js Jenkins plugin can install it for you. Also ensure that Chromium is installed: TestCafe cannot function without a browser.
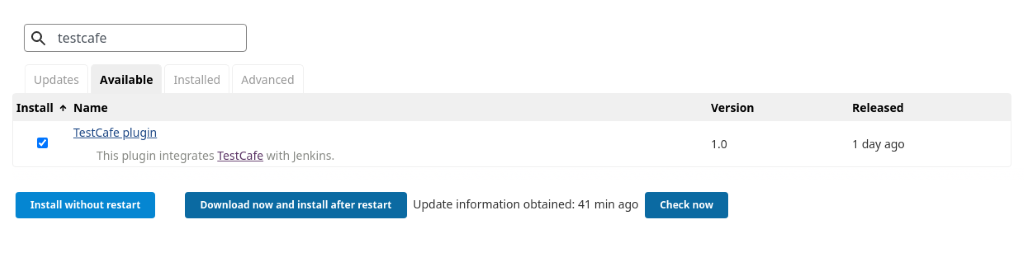
Step 2. Install the TestCafe Jenkins plugin
To install the TestCafe Jenkins plugin, click the “Manage Plugins” link on the Manage Jenkins page, select the “Available” tab, and enter “testcafe” into the search field. Check the box next to our plugin and click the ‘Install without restart’ button below it.
Step 3. Install the required Node packages
Add the following build step to your Jenkins project:
npm i testcafe testcafe-reporter-jenkins
This command installs the main testcafe library, as well as the testcafe-reporter-jenkins package. The latter is needed to generate Jenkins-friendly JUnit format reports.
Step 4. Configure the tests
You can configure your tests via:
- the command line interface
- the JavaScript/TypeScript API
- the .testcaferc.json configuration file
The last option provides an easy, declarative way to define your test settings. You can store this file in the same folder as your tests. Below is the configuration used in this tutorial:
{
    "browsers": [
        "chromium:headless:emulation:device=iPhone 4",
        "chromium:headless:emulation:device=iPad Mini",
        "chromium:headless"
    ],
    "src": "test/e2e/**/*",
    "screenshots": {
        "takeOnFails": true,
        "fullPage": true
    },
    "videoPath": "videos",
    "reporter": {
        "name": "jenkins",
        "output": "report.xml"
    },
    "appCommand": "node server.js"
}
The Browser array contains the list of browsers TestCafe will use to run our test. The TestCafe browser syntax allows us to specify the mobile devices we want Chromium to emulate.
The name property of the reporter object is set as jenkins, which ensures that the reports generated by TestCafe can be properly parsed by the server.
If you decide not to use a config file, be sure to manually set the report format when you launch the tests as follows:
testcafe chrome test.js -r jenkins:report.xml
Otherwise, simply run the following command:
npx testcafe
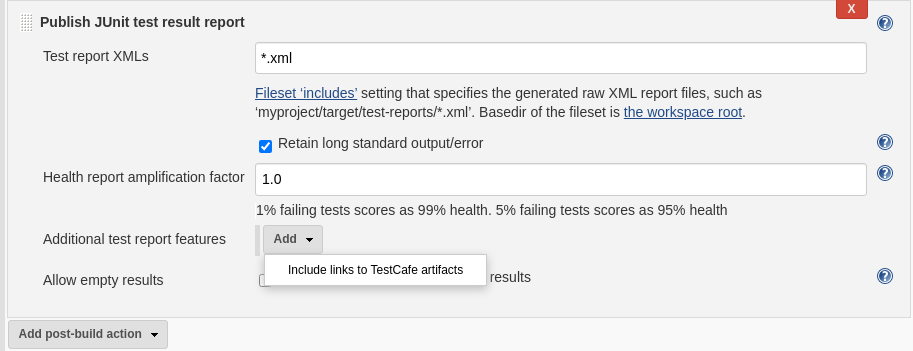
Step 5. Configure the reporter
Turn on the JUnit reporter plugin: add the “Publish JUnit test result report” post-build action. To display screenshots and videos alongside your test results, select the “Include links to TestCafe artifacts” option from the “Additional test report features” drop-down menu.
Important: Remember to check the “Retain long standard output/error” box. Otherwise, the reporter plugin will automatically truncate the URLs of your videos and screenshots.
Step 6. Run the build
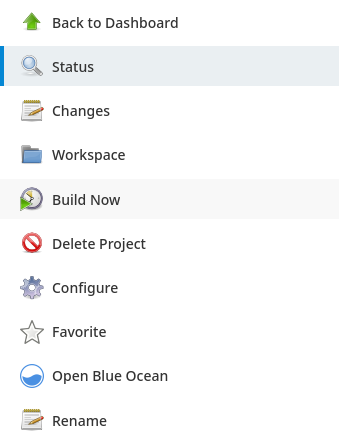
Save the changes to your project and click the “Build now” button on the project page:
Review the results
After the tests are completed, click the following link on the build page to view the results:
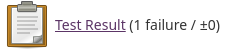
You will see links to screenshots and videos taken during the test.
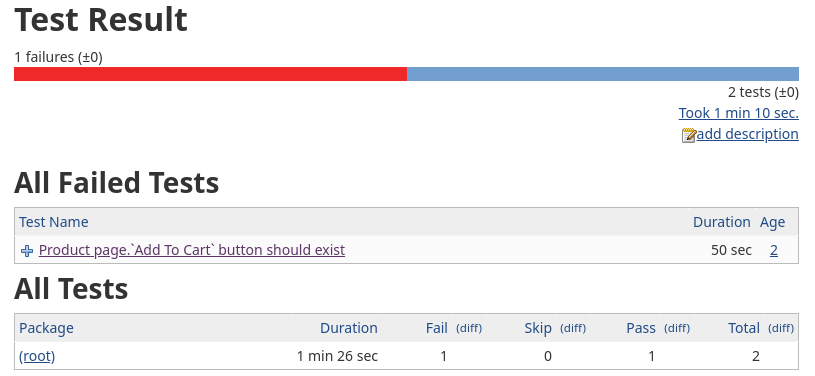
These artifacts instantly indicate if the Cart button is present on the page.
Jenkins Pipeline integration
If you do not wish to use the Jenkins GUI to launch these tests, you can always use the Jenkins Pipeline. It lets you declaratively configure your CI/CD setup via a Jenkinsfile - a text file checked into the project’s source control repository. The following is a sample Jenkinsfile to be used with TestCafe:
pipeline {
    agent any

    stages {
        stage('Run E2E tests') {
            steps {
                sh 'npm install'
                sh 'npm run test-e2e'
            }
            post {
                always {
                          junit keepLongStdio: true,
                          testDataPublishers: [[$class: 'TestCafePublisher']],
                          testResults: '*.xml'
                }
            }
        }
    }
}
Note: The test-e2e npm script in this example launches TestCafe. As mentioned earlier in this topic, be sure to manually set the reporter option. For more information on the TestCafe CLI, see the following help topic: Command Line Interface.
If you enjoyed this guide and would like more tips on debugging, please see the following blog articles: How to Debug Tests in TestCafe: Quick Guide and How to speed up debugging in TestCafe: Tips and Tricks.